Retail Analytics · ML Dashboard
Demand Forecast Intelligence
XGBoost · SHAP Explainability · Inventory Optimization
XGBoost
SHAP
28-Day
Project Overview
Retail demand forecasting system built using XGBoost, LightGBM and Random Forest on 135,000+ aggregated retail sales records. Features include lag variables, rolling statistics, calendar effects, event indicators and pricing signals. Forecasts are converted into inventory recommendations and explained using SHAP feature attribution.
Total Forecast Demand
—
units across all stores
Average Daily Forecast
—
per store-dept combo
High Risk Inventory
—
combos need review
Best Model RMSE
89.40
XGBoost · lowest error
Business Insights
4 KEY FINDINGSDemand Forecast
Forecasted demand exceeds 1.3M units for the next planning cycle across all stores.
Inventory Risk
1,204 store-department combinations flagged for immediate inventory review.
Best Model
XGBoost achieved RMSE 89.40 and MAPE 13.95% — best among all tested models.
Key Drivers
Rolling 7-day average + lag features account for 54% combined importance.
ML Pipeline
6 STAGESRaw Sales Data
Feature Engineering
XGBoost Training
Forecast Generation
SHAP Explainability
Inventory Optimization
Python
XGBoost
LightGBM
SHAP
Pandas
Chart.js
135K+
Records
31
Features
70
Series
1941
Days
Forecast & Risk Analysis
DEMAND TRENDS28-Day Forecast Trend
Aggregated daily demand across all stores
Inventory Risk Distribution
Store-department breakdown
Model Performance
BENCHMARKSModel Comparison
RMSE · MAE · MAPE across all models
Feature Importance
XGBoost gain-based · top 10
Project Details
MODEL SUMMARYBest Model
XGBoost
RMSE
89.40
MAPE
13.95%
Forecast Horizon
28D
SHAP Explainability
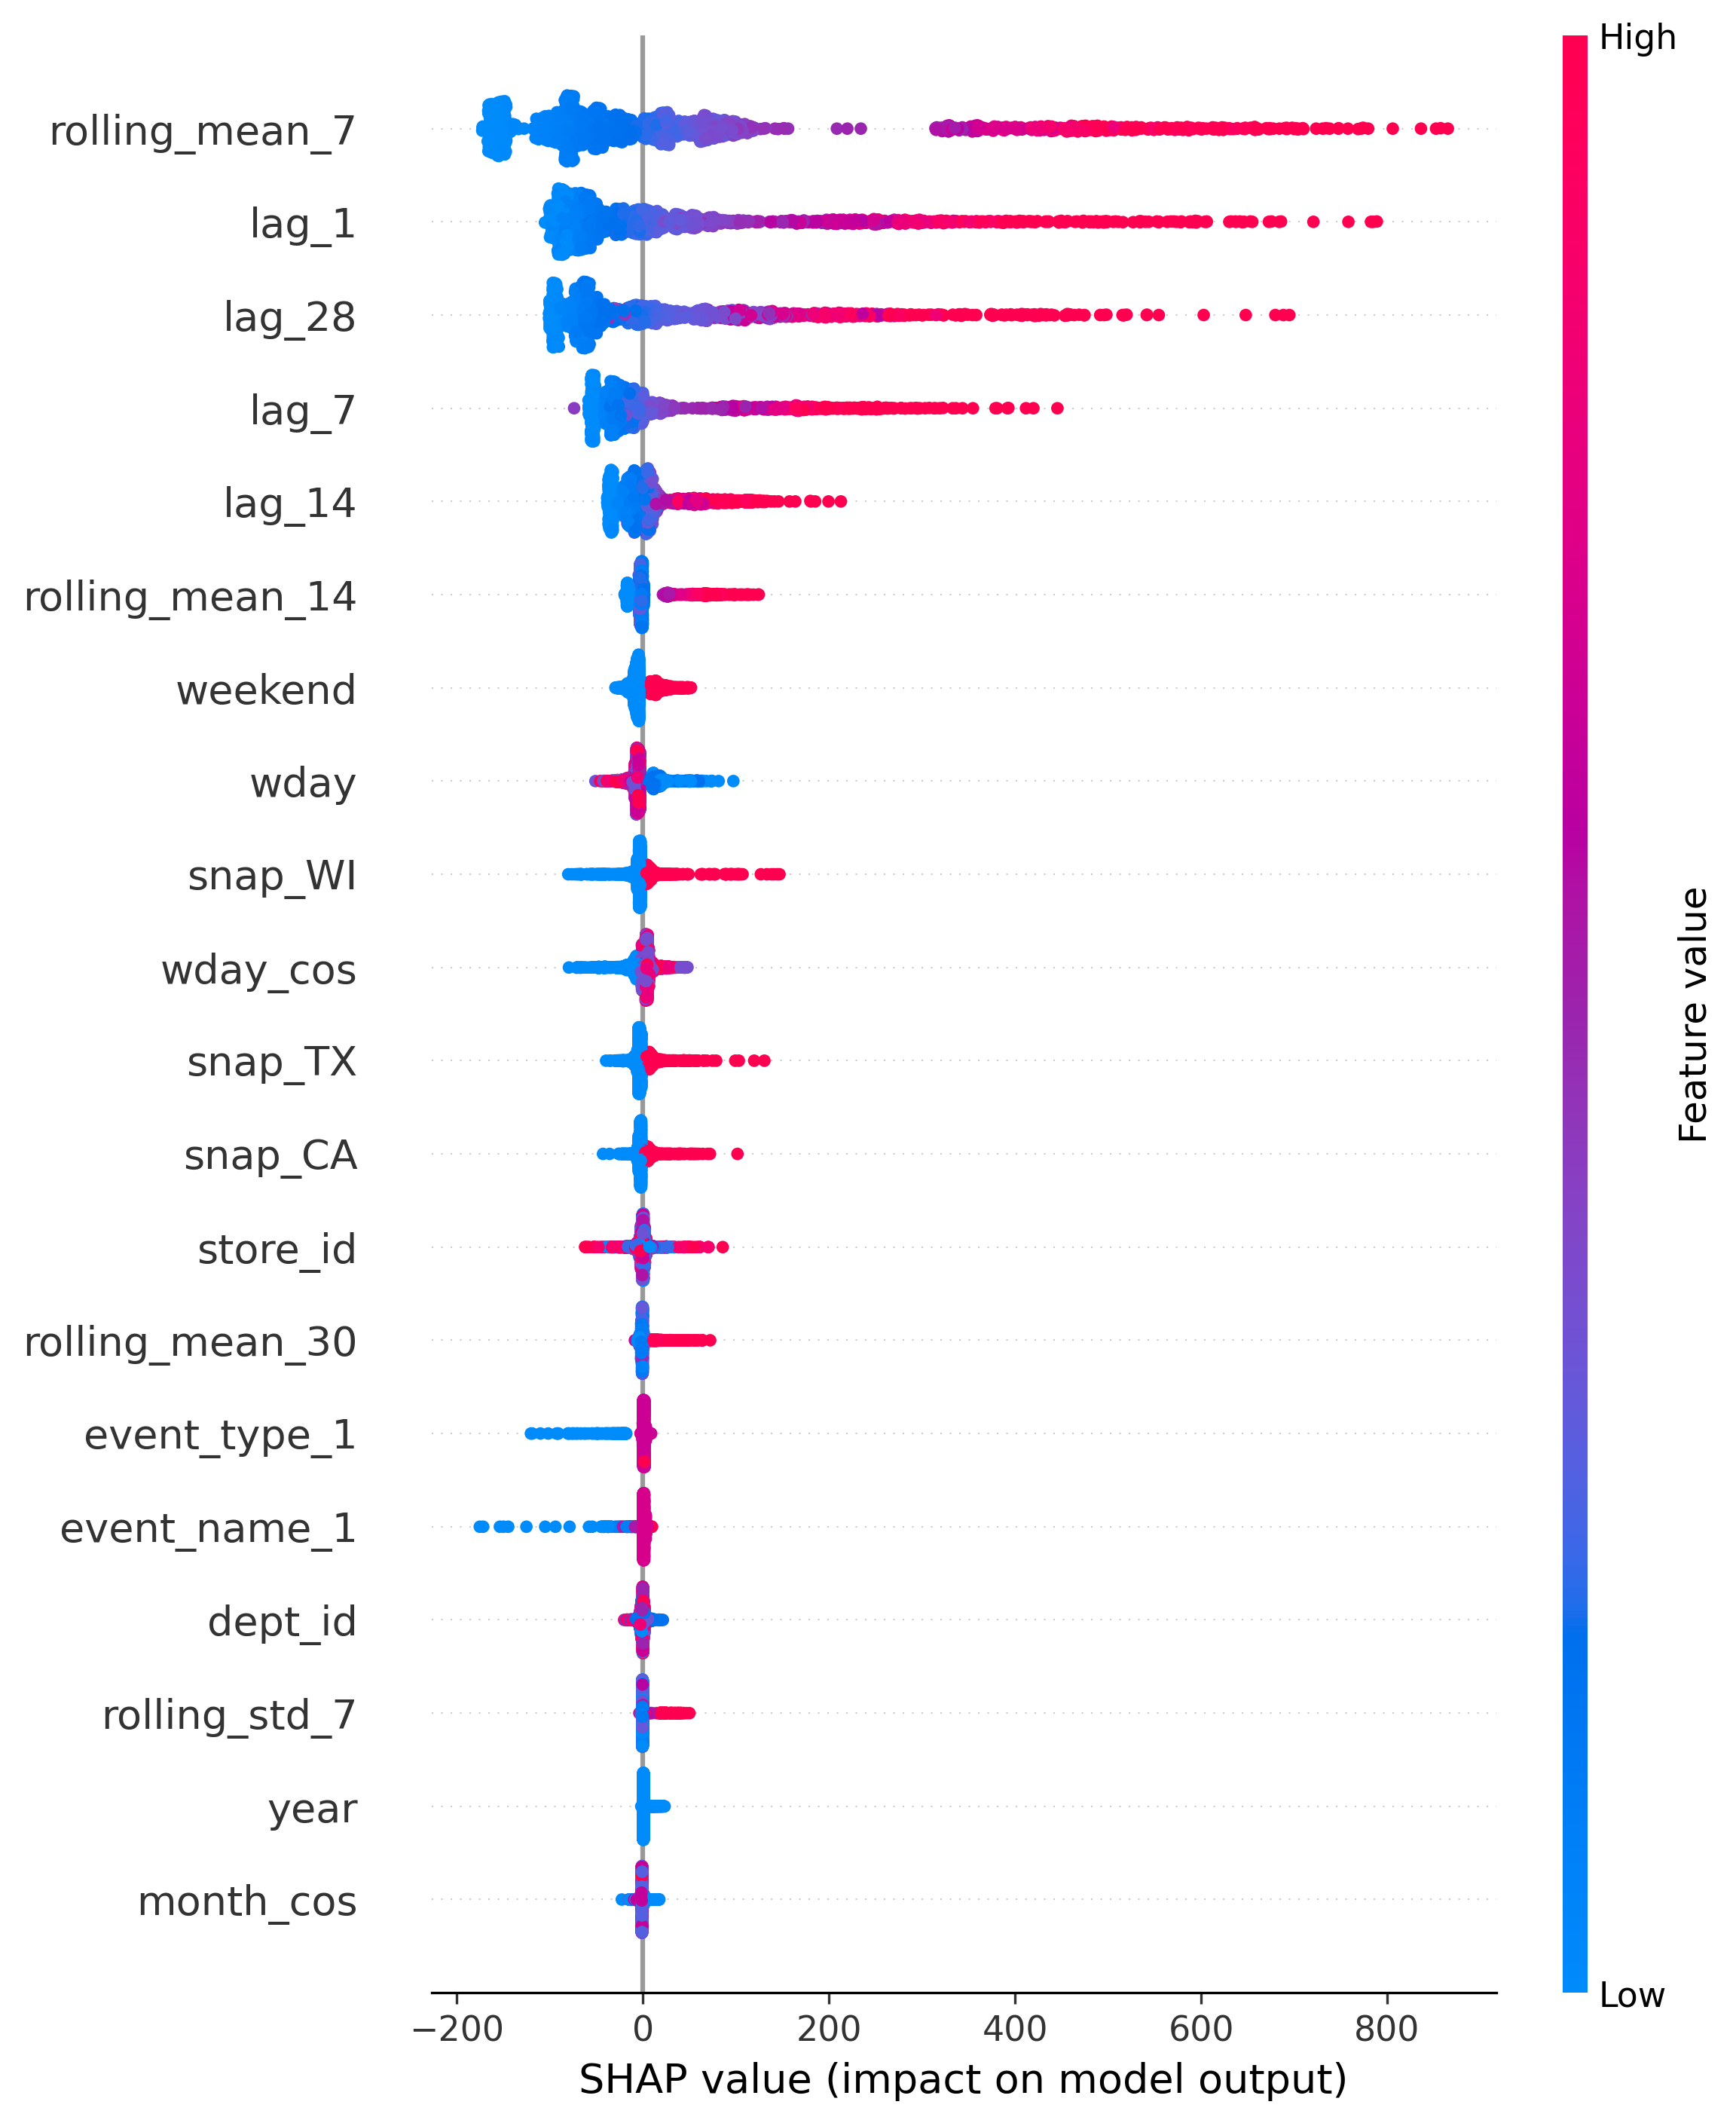
FEATURE ATTRIBUTIONSHAP Summary Plot
Generated from XGBoost predictions
Mean |SHAP| Values
Top 10 features by average impact
Recent sales history (rolling means + lags) contributes most strongly to predictions, confirming strong autocorrelation in retail demand.
Inventory Recommendations
ALL RISK LEVELS| Store | Department | Date | Forecast Sales | Safety Stock | Rec. Inventory | Risk Level |
|---|